Jock Mackinlay||Chris Stolte
Tableau Software||Tableau Software
Visual Interfaces for Databases
January 13, 2006
Although visual interfaces and databases are two of the success stories of
the computer revolution, their synergy to date has been modest, probably because
visual interfaces have focused on human capabilities while databases have
focused on efficient query processing. The success of visual interfaces started
with the GUI (Graphical User Interface), which supplanted the command line
interface by exploiting the power of the human visual motor system. Given
advances in graphics hardware in the mid 1980s, research started on Visualization,
the use of interactive, visual representations of data to amplify cognition.
We will briefly describe Mackinlay's dissertation, which formalized Jacques
Bertin's design theory, adding psychophysical data, resulting in a system
that could automatically design graphical presentations.
The 1990s were a fertile time for Visualization research, culminating in
a book co-authored by Mackinlay that included a formal reference model for
describing visualization systems. However, this research had little impact
on databases even though queries are essentially a command line interaction.
Rather, the success story of databases started with the invention of relational
databases that supported efficient transactions. The 1980s saw a huge effort
to rework our institutions to use computers to manage our vital data ranging
from our birth statistics to the legacy that we leave our children. In the
1990s we developed multi-dimensional databases to create data warehouses for
the efficient analysis of this data. However, analysis and exploration place
significant demands on the interfaces to these databases, which might be addressed
with visual interfaces for databases. Because of the size of the data sets,
dense graphical representations are more effective for exploration than spreadsheets
and charts. Furthermore, because of the exploratory nature of the analysis,
it must be possible for the analysts to change visualizations rapidly as they
pursue a cycle involving first hypothesis and then experimentation.
In this talk we describe an interface for exploring large multi-dimensional
databases that extends the well-known Pivot Table interface. The novel features
include an interface for constructing visual specifications of table-based
graphical displays and the ability to generate a precise set of relational
queries from the visual specifications. The visual specifications can be rapidly
and incrementally developed, giving the analyst visual feedback as they construct
complex queries and visualizations.
|
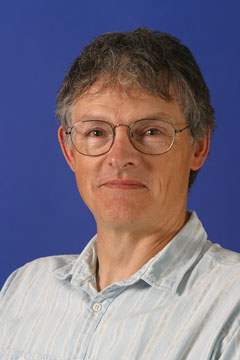

Jock Mackinlay received his PhD in computer science from Stanford University,
where he pioneered the automatic design of graphical presentations of relational
information. He joined Xerox PARC in 1986, where he collaborated with the
User Interface Research Group to develop many novel applications of computer
graphics for information access and to coin the term "Information Visualization".
Much of the fruits of this research can be found in his book, Readings in
Information Visualization: Using Vision to Think (Morgan Kauffman, written
and edited with Stuart K. Card and Ben Shneiderman). He holds numerous patents
in user interfaces and is a member of the editorial board of IEEE Computer
Graphics & Applications. In 2004, he joined Tableau Software as Director
of Visual Analysis.
Chris Stolte is a co-founder of Tableau Software and Vice President of Engineering.
Chris has been researching the visual analysis and exploration of databases
for the last eight years and his research has resulted in ten research publications
and two large-scale visualization systems. Chris was also CTO and co-founder
of BeeLine Systems, a visualization software company that developed a revolutionary
map rendering system. BeeLine was purchased by Vicinity Corporation (NASDAQ:
VCNT), and its products are currently used to generate over a million maps
a day. Chris is a co-inventor on five software patents related to information
visualization. He holds a Ph.D. in Computer Science from Stanford University,
and a B.S. in Computer Science from Simon Fraser University. |
|