Part 1
Set up an Amazon Web Services (AWS) account following this tutorial.
Brush up your knowledge of Map/Reduce here.
We'll be working with two main parts of AWS: Amazon Simple Storage Service (S3) and Amazon Elastic MapReduce (EMR), which is essentially a Hadoop framework running on Amazon's Elastic Compute Cloud (EC2). On S3, data is stored in "buckets", which can be either private or public. For Part 1 of the assignment, we've created a public bucket called cs448g-data containing 2 data sets: the first comprises the entire works of William Shakespeare; the second is a text dump of all article pages on Wikipedia (English version).
Part 1a: Learning to Run a MapReduce Workflow
The Shakespeare data set is small, and thus ideal for learning how to set up and debug MapReduce workflows. We're going to start with the simple example of counting word frequencies in a text. The first useful thing to know is that EMR provides a word count script as part of its example suite.
- Log into AWS, and click on the Elastic MapReduce tag, and click "Start a New Workflow".
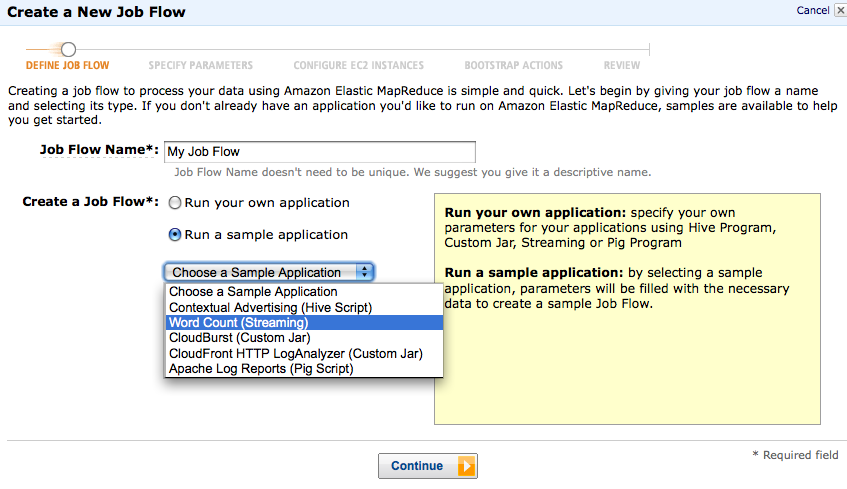
- In the frame that pops up, name your workflow (if you'd like), and choose to run a sample Word Count (streaming) application. Continue.
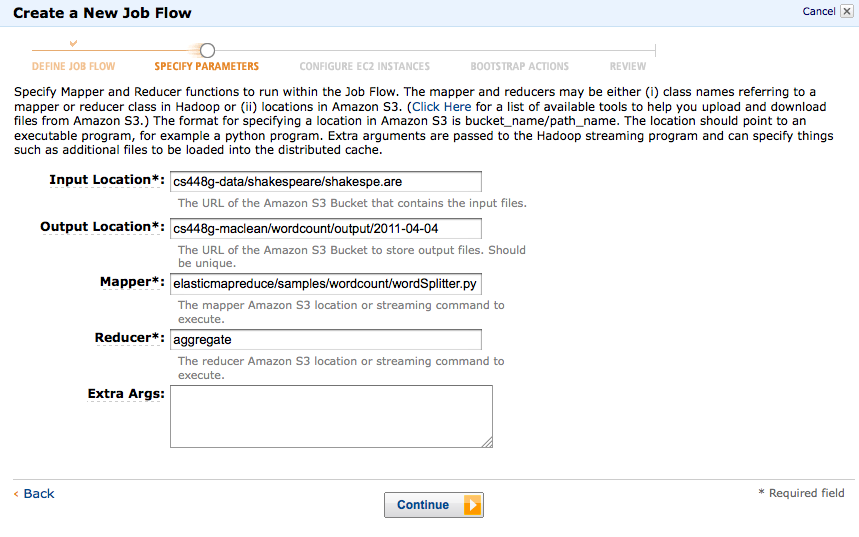
- The next frame is where you choose what files to input, where to output, and what mapper and reducer scripts to use. For now, use cs448g-data/shakespeare/shakespe.are as your input (as shown below), and output to a folder of your choice in your own bucket. The mapper and reducer scripts are already provided. Continue.
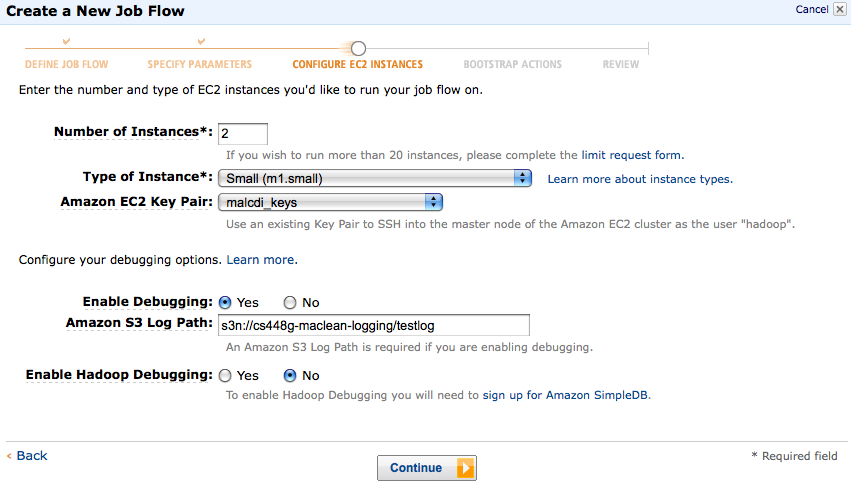
- You probably don't want to change any EC2 configuration details for this task. Two small instances will be sufficient. Make sure your own key pair (explained in the setup tutorial) is selected, and enable debugging if you wish (recommended). Continue.
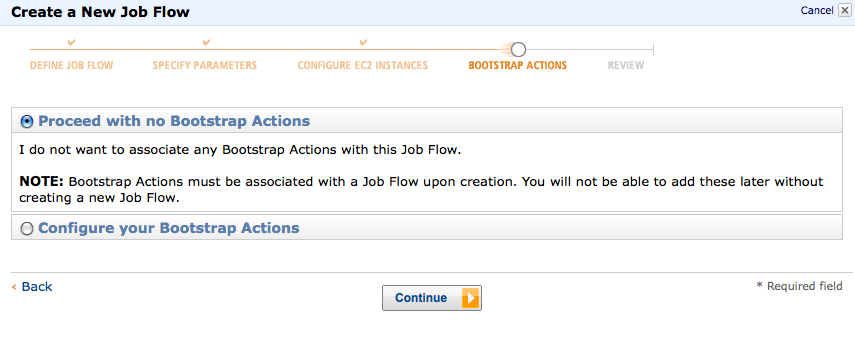
- Ignore the bootstrap options for now, and click through to the final frame, where you can review all of your settings for the job you're about to run. If everything looks correct, go ahead and "Create a Job Flow". You'll be taken back to the AWS Management console, where you'll see the status of your job flow. You can refresh this page (using the internal refresh button on the top right of the icon bar) to check on your job state. It is quite normal for your job to take some time (even a couple of minutes) to get up and running.
- Once your job is complete, you can find it in your S3 bucket/folder that you specified as the output location. It will be called 'part00000', or some such thing. Use the S3Fox console to transfer this file onto your own computer, and take a look.
Part 1b: Sorting Output and Removing Stopwords
You'll notice that the output is unsorted. Also, we've been using sample map and reduce scripts - although the aggregate reducer is convenient and fast (you can read more about it here) it would be nice if we could write our own processing scripts. We've provided mapper.py and reducer.py, basic map and reduce scripts written in Python. (If you would like to write your map/reduce scripts in another language, however, feel free to do so.) Download these scripts onto your own computer, and edit the reducer.py script so that it outputs terms sorted by frequency. (Consult the "Operator Module Functions" section on this page if you get stuck.) You can test the results from the command line by executing the following command:
echo "foo foo quux labs foo bar quux" | python mapper.py | python reducer.py
which should output:
foo 3
quux 2
labs 1
bar 1
Now that your scripts are working, upload them to your bucket, and run them over the Shakespeare corpus as follows:
- Start a new workflow.
- This time, choose to run your own streaming application.
- Instead of using the default map/reduce scripts, however, fill in the paths to the mapper.py and reducer.py scripts that you just uploaded. Again, use cs448g-data/shakespeare/shakespe.are as your input, and output to a folder of your choice in your own bucket. (Be careful to use a new location, though, as the job will fail if the output location already exists.)
- Continue as before, and take a look at your results once you're done. Finally, you'll notice that many of the most frequent words are not very interesting. Here is a list of stop words (common but uninteresting and uninformative words in text) taken from the Python NLTK toolkit. Here is the same list in easy-to-use python format. It is not very long. Incorporate this list (directly) into your mapper.py script to filter out any words that are in the stop word list. (Feel free to edit the stop word list, but be prepared to explain your edits in your write up.) Upload your updated scripts to S3.
Part 1c: Word Frequencies in Wikipedia
Once you're happy that your scripts are working on the Shakespeare corpus, it's time to see how we do on a really large data set. cs448g-data/wikipedia/* is a large (~9GB) collection of files containing the current English text for all articles on Wikipedia as of 03/21/2011. For those of you familiar with Wikipedia content dumps, we've cleaned up the XML file (origianlly 30GB) so that only non-marked-up text of the following format remains. That said, our data cleaning isn't perfect - something you may notice once you get your results. You can see a sample of the cleaned data here.
Run your MapReduce job on the Wikipedia data set as before. You'll want to dial up the number of instances you're using -- you can take a look at the price list to determine how many instances you want to run, but it's unlikely you would go over in any case. As a bench mark, 6 small instances should get the job done in ~3-4 hours.
Whereas with the Shakespeare data you probably only got a single output file, this time you will get several output files (parts). Take a look at your part files. You will notice that while terms are sorted by frequency within files, they are not sorted between files. Given what you know about MapReduce, can you explain why this is?
You will need to consider all of the part files to get the top 100 terms. You may do this any way you choose - we recommend using some sort of quick scripting language such as Python; if you pick a subset of the terms in each file (say, the first 100 terms from each), you might also be able to use a spreadsheet. Finally, feel free to modify your stopwords list and re-run if you notice any obvious XML artefacts in your results.
Submission Details (Part 1)
You should submit a text file named top100.txt that contains the top 100 words generated by your scripts in Part 1c, as well as your mapper.py and reducer.py (or equivalent) scripts. If you modified the stopwords list, then please include that, too. All files should be submitted via e-mail in a zip file named LastnameFirstname_A2_Part1.zip.
This is an individual assignment due before class at 8am on Monday April 11. Please submit your part 1 zip file to cs448g@cs.
Part 2
The second part of this assignment is to utilize your MapReduce skills in an experiment of your own design on some large data set. More specifically: pick a data set to work with, and formulate an hypothesis about it. (Due to the nature of this assignment, your hypothesis should be amenable to testing via MapReduce.) Next, design an experiment to test your hypothesis using the AWS services. Once you are confident in your design, run your experiment.
In no more than 3 pages, write up your experiment, including details on your data set, your hypothesis, your experimental design, your results, and your conclusions. In particular, be sure to justify the analytic validity of your experiment, noting possible confounding factors (such as bias, statistical validity etc.) and approaches you could take to mitigate these. Discuss your results and how they relate to your initial hypothesis. Feel free to include charts and other visual elements, over and above your detailed, written explanation.
To get started with this part of Assignment 2, it may be helpful to take note of the following:
- This assignment may be a good opportunity conduct some exploratory analyses on a data set that you're thinking of using for your final project. Exploratory hypotheses such as: "the distribution of first-letters over all text in Wikipedia is uniform", "most Twitter users have more "followees" (people that they follow) than followers", or "the set of words most commonly associated with "democracy" on conservative blogs is different from the set of words most commonly associated with "democracy" on liberal blogs", are perfectly acceptable.
- We want you to extend your knowledge of writing MapReduce processes beyond simple word frequency counts. Your process may still be structurally similar (many MapReduce processes are, by nature of the fact that you're mapping and then reducing over (key,value) pairs), but we expect to see some additional creativity in structuring your problem as a MapReduce workflow. Please feel free to ask questions about this!
- While we would like you to utilize large data sets, these can be difficult to come by. You will not be penalized for using a smaller (e.g. 100's of MB) data set. You may also use the Wikipedia data set provided for Part 1, as long as you take care to define a creative, interesting and novel hypothesis.
- You may use EC2 independently of EMR for this part of the assignment. If you decide to do so, remember to shut down your instances when you're done, or else you will be billed for them until you do.
Submission Details (Part 2)
Please put your data, scripts, and part-0000* files in S3 buckets named cs448g-lastname-a2p2-data, cs448g-lastname-a2p2-scripts, cs448g-lastname-a2p2-results, respectively, and make these buckets public. In a zip file named LastnameFirstname_A2_Part2.zip, please submit your write up and any processed (i.e. not raw part-0000* files) result files that you used for your discussion.
This is an individual assignment due before class at 8am on Monday April 18. Please submit your part 2 zip file to cs448g@cs.